
In order to properly assess the results of your webshop / sales location, statistics are of great importance. PAY. has therefore invested a great deal of time in developing statistics, which can be divided into:
- Paid Transactions
- Management Statistics
- Trend Statistics
1. Using Filters
Filter Type, Operator and Value

Statistics are only really useful if filters can be set, so that you can retrieve specific data. A filter consists of 3 fields: Image: Filter type, operator and value
- Field 1: Type
There are more than 30 different types you can filter on, such as payment option or sales location - Field 2: Operator
The available operators are 'equal to', 'not equal to', 'less than', 'greater than' and 'contains' - Field 3: Value
Here you can enter the value of the type you want to filter on. Where applicable, choices are shown in a select box.
Setting a Filter
For both the paid transactions, management and trend statistics you can very easily make use of one or more filters. Follow the steps below to do so.
Filter

- Go to the Reports » Management https://admin.pay.nl/statistics (you can also find the filter under 'paid transactions' and 'trends').
- Under the field Filter you will see a checkbox; check it to activate the filter. Image: Activating the filter
- A new line appears where you can enter the 'type', 'operator' and 'value' fields Image: Filter. Do you want to add an extra filter? Click the green 'plus' icon.
- Enter the data you want and click the 'Retrieve Data' button to apply the filter
2. Available Filters (Fields)
Availability of Filters and Group (Display) Functions
PAY. makes about 30 filters available for generating reports. The availability of filters within your package type is shown below.
 Pioneer Pioneer |
 Professional Professional |
 Business Business |
 Corporate Corporate |
|
|---|---|---|---|---|
| View paid transactions | ✔️ | ✔️ | ✔️ | ✔️ |
| Export paid transactions | ✖️ | ✔️ | ✔️ | ✔️ |
4. Management Statistics
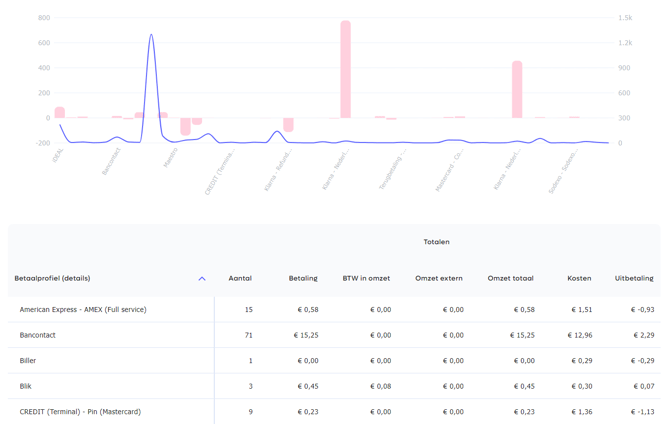
The management statistics show the results in a graph and a table. Unlike with 'paid transactions', you can group a specific selection to make the results clearer.
Management Statistics
Viewing Management Statistics
To view the 'Management statistics', follow the steps below:
- Go to the Reports » Management Statistics https://my.pay.nl/statistics.
- Under the field Period Image: Selecting the desired period select the dates for which you want to see the results. You can choose a default value such as 'This week' or a custom value using the 2 date fields.
- Optionally you can set a filter so that you can display the results for a specific selection.
- Via the field View display per you can group the selection (for example per day) and set whether you want to see the results on your Screen (default) or want to export to a PDF or CSV format.
- Finally, click the 'Retrieve Data' button to display the management statistics Image: Management statistics.
Exporting
Exporting Statistics
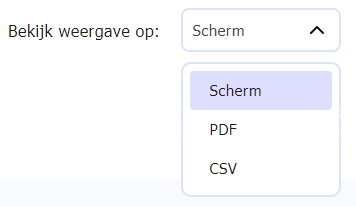
You can export the results of your search to a PDF or CSV format. Exporting these statistics is an option available from the Professional package.
- Go to the Reports » Management https://my.pay.nl/statistics.
- Under the field View display per you will see a default option 'Screen'. Select the format you want to use for displaying / downloading the results here. Image: Exporting statistics
Availability
Below you will find within which packages the 'management statistics' are available.
| Pioneer |
Professional |
Business |
Corporate |
|
|---|---|---|---|---|
| View management statistics | ✔️ | ✔️ | ✔️ | ✔️ |
| Export management statistics | ✖️ | ✔️ | ✔️ | ✔️ |
5. Trends
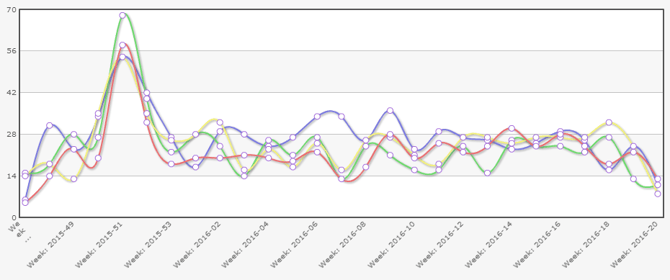
Via the trend statistics it is possible to compare certain selections with each other. For example, you can determine at which hour of the day the most orders are placed, and you can view the trend of the past few months.
Selecting the Desired Period

Setting Trends
Comparing Results
Grouping Trends

Trends
Viewing Trend Statistics
To view the 'Trend statistics', follow the steps below:
- Go to the Reports » Trends https://admin.pay.nl/statistics/compare.
- Under the field Period Image: Selecting the desired period select the dates for which you want to see the results. You can choose a default value such as 'This week' or a custom value using the 2 date fields.
- Optionally you can set a filter so that you can display the results for a specific selection.
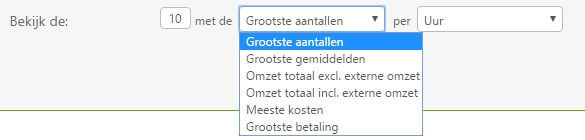
- Via the field View the Image: Setting trends you can indicate exactly which trend you want to see. The criteria you can choose from are as follows:
- Highest numbers
- Highest averages
- Most revenue excluding external revenue
- Most revenue including external revenue
- Highest costs
- Largest payment
- Then click the 'Retrieve Data' button.
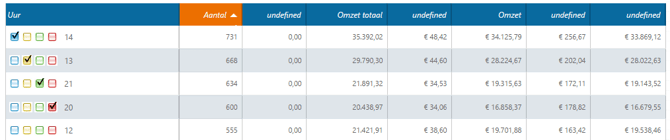
- The results are retrieved and displayed in a table Image: Comparing results. In the first column you see colored checkboxes. You can check these so you can compare the results in a graph.
- After you have checked the desired checkboxes, you can display at the bottom left of the table how you want to order the results Image: Grouping trends (for example number of transactions per week).
- Then click the 'Retrieve Data' button at the bottom of the table. The trends are then displayed in a graph Image: Trends.
Availability
Below you will find within which packages the 'trend statistics' are available.
| Pioneer |
Professional |
Business |
Corporate |
|
|---|---|---|---|---|
| View trend statistics | ✖️ | ✔️ | ✔️ | ✔️ |